The Office of Student Records and Registrations:
Number of Graduates Surveyed: 5337
Response Rate: 39.9%
The graduates were asked to respond to several questions regarding their attitudes about UNK in general. These question were designed to obtain information regarding the graduates general satisfaction with UNK and a little about their future plans.
Do you currently have plans for additional education?
| 1. No, not at this time. | 48.2% |
| 2. Yes, at UNK | 11.7% |
| 3. Yes, somewhere else | 18.0% |
| 4. Undecided | 21.9% |
What is the highest degree you ultimately plan to earn?
1. Bachelor's Degree 18.4% 2. Master's Degree 55.2% 3. Specialist Degree (Ed.S.) 4.8% 4. Professional Degree (law, medicine, etc.) 5.1% 5. Doctoral Degree 16.1%
If you had to do it all over again, would you chose to attend UNK again?
YES 85.7% NO 13.4%
Would you recommend UNK to someone looking for an institution in which to further their education?
YES 90.6% NO 8.1%
What was the single most important factor that led to your selection of UNK as an institution in which to further your education?
1. Cost 21.9% 2. Location 43.7% 3. Academic Excellence 4.2% 4. Friends, Relatives 8.7% 5. No Particular Reason 3.3% 6. Other 18.0%
Note: Some responses do not total 100% due to respondents skipping or not answering the questions.
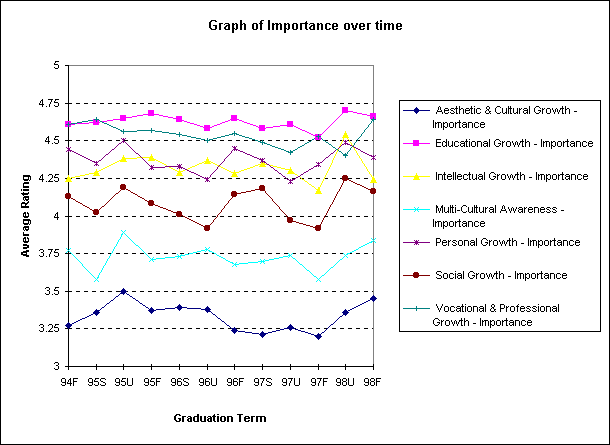
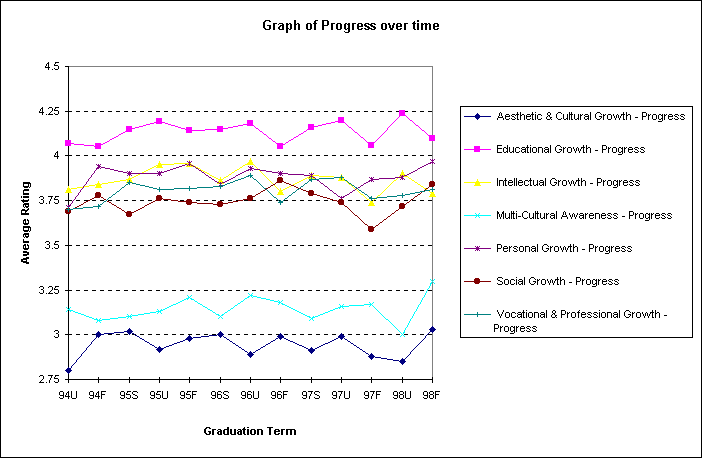
The graduating student survey asks the graduates to respond to statements regarding areas of growth and development that can be influenced in higher education. The graduates responded on a scale of 1 to 5 with 5 indicating the greatest progress or importance. The rating scales used:
| Progress | Importance |
|---|---|
| (1) No Progress | (1) Of no importance |
| (2) Little Progress | (2) Of little importance |
| (3) Moderate Progress | (3) Of moderate importance |
| (4) Much Progress | (4) Of much importance |
| (5) Very Much Progress | (5) Of very much importance |
Areas of Growth and Development
The following charts summarize the results from graduates surveyed from 94 Fall through 98 Fall:


(17-Apr-98)